27 January, 2006: Ping
So, an ID cards update and some miscellanea.
On ID cards, there is finally some good news. The House of Lords has amended the Identity Cards Bill to require the Government to prepare an estimate of the costs and benefits of the scheme, and for the Auditor General to write a report on that estimate, and lay both before Parliament before most of its provisions can come in to effect; and to remove the power of the Home Secretary to compel people to register in the National Identity Register, either explicitly or by the subterfuge of making them do so at the same time as applying for a passport or another ``designated document''.
Of course, we shouldn't be too hopeful. The House of Commons can always back out the amendments, and while a voluntary ID card scheme was a Labour manifesto commitment, the Labour Party isn't known for keeping to those, and nor, it seems, are they all that troubled by responsible use of public money. So it's perfectly possible that both amendments will be removed by the time the Bill becomes law. This will, of course, offer the entertaining spectacle of Labour MPs being heavily whipped to vote against one of their own manifesto commitments, but such is politics.
In other news... I've been horribly busy, hence the lack of posts here. See my linklog for interesting(ish) stuff I've been reading on the web lately; you may also be amused by Postcodeine, a trivial geographical toy.
Sorry, no holiday photo this week -- must get some sleep....
5 January, 2006: Where in the world?
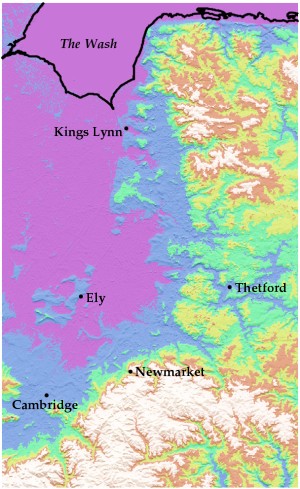
OK, that's enough of that. I was impressed that two people got the right answer (Tom wasn't far off, either). Here's a labelled map:
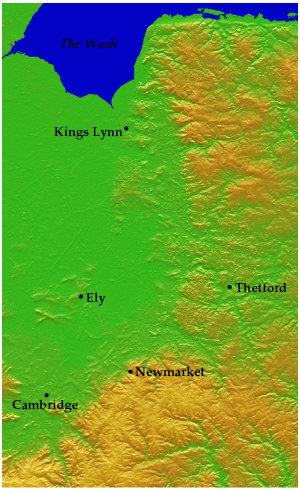
and one with slightly more conventional colouring:
The data come, incidentally, from the Shuttle RADAR Topography Mission, which, pace Maciej Ceglowski, is one of very few useful things that've been done with the shuttle. The reason I was looking at this in the first place was equally as silly as the map itself. I remember being told years ago something like,
if you draw a line eastwards from the top of Castle Hill in Cambridge, the first time it crosses higher ground is when it reaches the Urals
-- this theory being advanced as explanation for Cambridge's lousy winter weather. It's nonsense, of course, topographically and meteorologically. That didn't stop me wondering what the actual topographic profile looks like. Here it is:
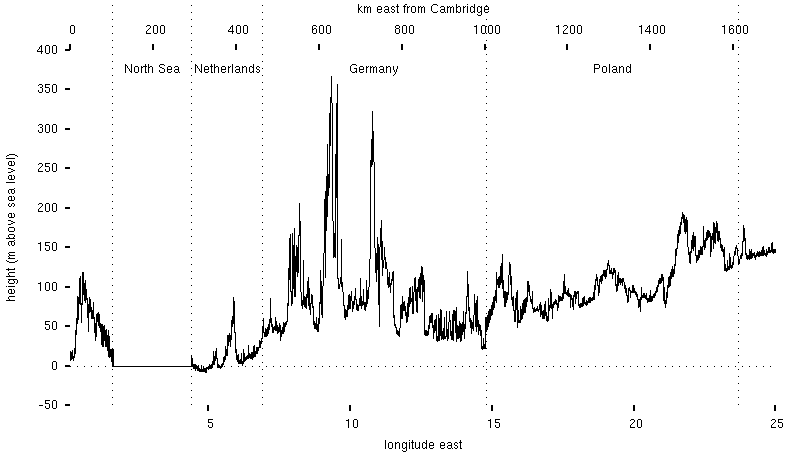
The Urals lie a further two thousand or so kilometers to the east.
4 January, 2006: Why ... can't read maps
A silly post for today. Firstly, of what area of the world is the below a topographic map?
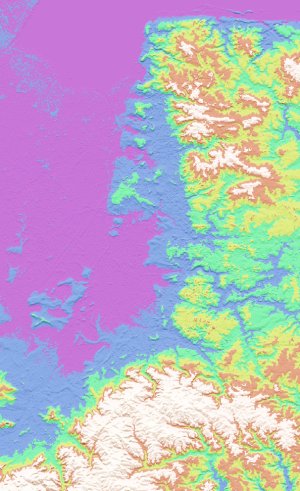
(Clues: the map is in the conventional orientation and is of a real place. You shouldn't need anything more to work it out than that. Answer tomorrow, or, at least, once enough amusing answers have accumulated.)
Secondly, since I try not to just post links to other stuff on here, I've... added a linklog for that purpose. RSS here.
1 January, 2006: Ask a stupid question...
So, Happy New Year to all my readers. And with the pleasantries concluded, it's back the frankly tedious subject of the cost of Parliamentary questions. Following my Freedom of Information request, a nice chap in the Treasury has sent me a bunch of information on the cost estimates which the Treasury prepares on Parliamentary Questions; the summary goes like this--
- The current figures are based on the results of a study which was done in 1991 over questions asked of six departments during a three month period, with the values for the average and marginal costs in subsequent years being estimated by assuming that the costs have risen by a weighted average of the inflation of consumer prices (25%) and of civil service wages (75%); the rationale for this choice of weighting is slightly unclear. A follow-up survey was considered and determined to be unnecessary in 1999 (i.e., the estimates obtained from indexation were deemed to be good enough).
-
The 1991 survey quotes average costs which are, as Daniel suggested, ``fully-allocated''; the marginal cost quoted was obtained as follows:
3.1. For written PQs the marginal cost of one extra PQ can be taken as the Costs within Divisions [i.e., of departments] excluding the fixed cost of staff accomodation. This marginal cost is £50 per written PQ.
This corresponded to, on average, about 2½ hours' work per answer.
Prior to 1991, the quoted costs were based on information from a survey in 1972, and were quoted as marginal costs. The justification for the change is given:
2.1. At the time of the last review, in 1972, accommodation costs were excluded on the grounds that ``the work on PQs was so thinly spread over the work of the Civil Service as a whole and formed only a minor part of an individual's workload'' so that a marginal cost approach was then considered justified.
2.2. However, in 1991, answering PQs merits a prominent place in the work of departments and the use of full cost, including accomodation cost, is appropriate.
2.3. Only in one case is the marginal cost approach worth retaining and that is for calculating the cost of high cost written PQs to compare with the Disproportionate Cost Threshold. This contributes to ease of calculation.
I agree with the conclusion of the final paragraph, but not with its logic. Surely the marginal cost is the correct one to use in considering whether the cost of answering a further, difficult, question is ``disproportionate''? In any case, I'm certain that the marginal cost is the one relevant to whether an MP should ask another question.
So, what happens if we correct for the indexation which has been applied to the estimates? This:
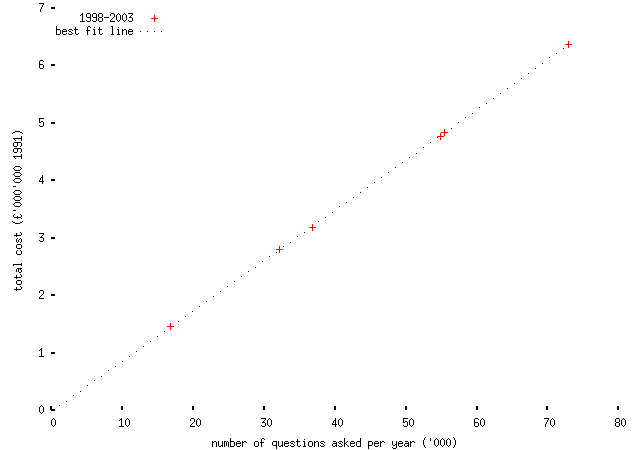
-- i.e., a perfect straight line (as expected), but still no evidence for any fixed costs, which is bizarre given that the the 1991 survey certainly found some!
The error here is that the quoted average costs are nonsense, because the indexation takes no account of the variation in the number of questions asked in each year; that means that the quoted annual total costs are also rubbish. Specifically, suppose that the costs in 1991 followed the model T = F + nd (total cost equals fixed cost plus number of questions times direct cost) and therefore the average cost A = F/n + d. In a later year the costs follow T' = F' + n'd' and A' = F'/n' + d'. However, the quoted average cost is not an estimate of A' but rather is iA = iF/n + id, where i is the indexation constant (1.59 by 2003); the difference between these two estimates, and therefore the correction to be applied to the quoted average costs, is iF(n - n')/nn'.
Taking this into account, and using the quoted marginal cost as the estimate of iF/n, gives a result as expected; the fixed cost of answering written questions was about half a million quid per Parliamentary session in 1991. And so we can correct the figures given in Hansard by Stephen Timms a year ago, as follows:
-- i.e., the Treasury estimates of average cost per question are typically around 30% over the true average costs, even if you accept that the methodology by which they're calculated is sensible. As it happens, it isn't; two obvious problems stand out. Firstly, fixed and direct costs are unlikely to suffer the same rate of inflation. Secondly, the 1991 study implicitly assumed that the fixed costs of answering written questions over all departments was simply proportional to the total number of questions asked of all departments, which isn't obviously sensible. And note, (emphasis mine)
5.1. Average costs per PQ varied widely across departments. This partly reflected the style of the department concerned (ranging from ``fast throughput of large numbers'' -- up to ``in-depth consideration of potentially important subjects with due consideration''). [...] Consequently, the survey is felt to have provided a wide and representative mix. Its value is in the totality of the mix and, by agreement, separate figures are not being published for each department.
So, in summary, I think the quoted average cost of answering a written question is something of a nonsense. However, the estimate of the direct (``marginal'') cost is relatively sensible, since it was based on a measurement of staff time expended. Happily it is the latter which is used to set policy (on the maximum cost of answering a question before it may be refused on grounds of disproportionate cost).
Of course, we only have one estimate of this figure, from 1991, based on answers to about 1,600 questions, and with no estimate of its variability or accuracy. And whether typical answers still take around 2½ hours of staff time per question answered remains accurate today, almost fifteen years on, is less clear. For instance, you might expect that increasing use of IT will have made answering some sorts of questions much easier.
Anyway, I'm not really sure what useful conclusion to draw from this, beyond that the Freedom of Information Act really works, and that no government statistics should be trusted until you've seen the methodology used to compile them. Task for next week: find someting more interesting to write about.
(Update: I should have mentioned that I haven't put up a copy of the stuff I got from the Treasury because of the Crown Copyright in official documents nonsense: I haven't gone to the trouble of transcribing it, and I'm not allowed to put the scanned copies on the web. If you really want a copy you could (a) ask the Treasury yourself -- the document you want is from 1997 1999, is titled ``Quinqennial Review of the Costs of Answering PQs'', and you want the appendices, which include the 1991 report, too; or (b) ask me, but that depends on my having a moment to type the thing in, or hassling somebody with some OCR software.)
